
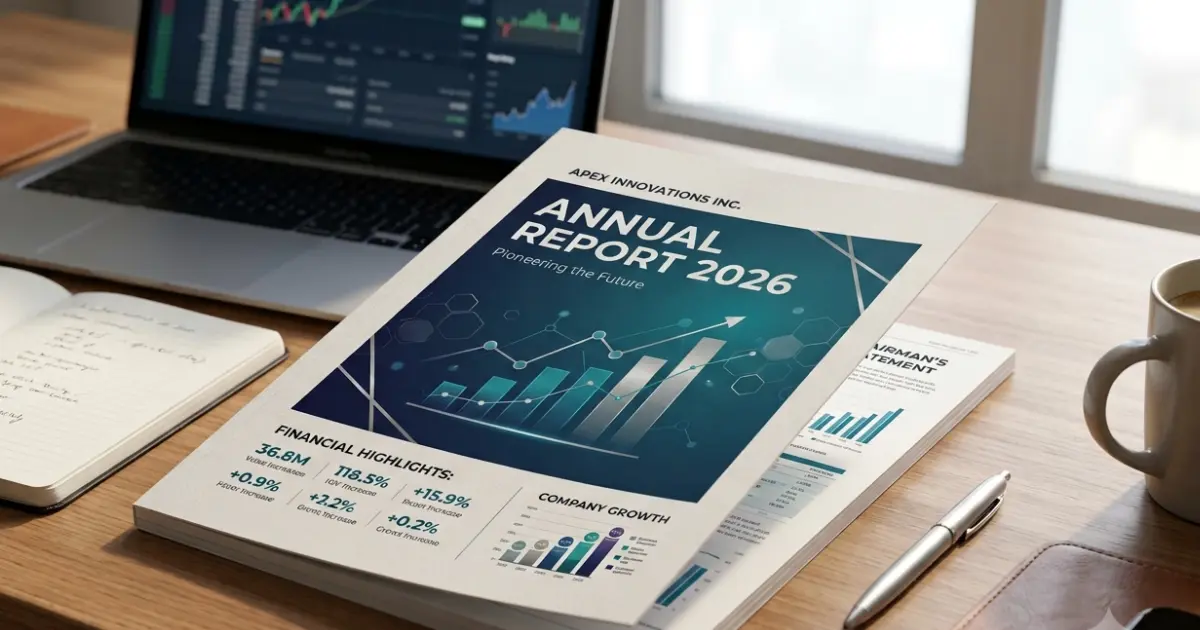
Why Reading Annual Reports Matters for Stock Investing
Investing in the stock market without reading a company’s financial annual reports is like buying a used car without popping the hood.
News headlines, social media tips, analyst target prices, and stock-market commentary can create plenty of noise. But if you want to understand what a company actually owns, earns, owes, and generates in cash, one of the most important primary sources is its Annual Report.
For a DIY investor, learning to read an annual report can turn investing from a guessing game into a structured decision-making process.
You don’t need to read every page. You need to know where to look, what numbers matter, what questions to ask, and which warning signs deserve further investigation.
This guide provides a practical framework for doing exactly that.
Before evaluating individual companies, it is also worth considering whether investing in the stock market is right for you.
Table of Contents
Where to Find a Company’s Annual Report
Before analysing a company, get the actual annual report—not a summary from a stock-tip channel or a broker’s app.
Reliable sources include:
- The company’s Investor Relations page: Search for “[Company Name] Investor Relations” or “[Company Name] Annual Report.” Listed companies generally provide annual reports under an “Investors” section.
- Stock exchange websites: In India, the NSE and BSE provide company filings and financial information. These are useful primary sources for listed-company filings.
- Ministry of Corporate Affairs (MCA): The MCA portal provides statutory filings and other company information. It can be particularly useful when you need information beyond what is easily available on the stock exchanges.
- Financial research platforms: Websites such as Screener.in and Moneycontrol can make financial data easier to analyse and compare. They are useful for cross-checking, but important conclusions should be verified against the company’s original filings.
A Quick Tip
Always check the financial year covered by the report.
Don’t assume that the first annual report appearing in a search result is the latest one. Look at the cover page and confirm the financial year-end date.
Section 1: The Anatomy of an Annual Report
Annual reports can easily run into hundreds of pages. Reading one from the first page to the last isn’t necessarily the best way to analyse a company.
Instead, think of the report as having two broad purposes:
| Section Type | What It Contains | What You Should Look For |
| Business Context | Management Discussion & Analysis, Directors’ Report, Corporate Governance | Industry conditions, business risks, strategy, management commentary |
| Financial Core & Audit | Auditor’s Report, P&L, Balance Sheet, Cash Flow, Notes | Profitability, debt, cash generation, accounting policies, risks and disclosures |
The Non-Financial Sections
Management Discussion & Analysis (MD&A)
The MD&A provides management’s explanation of the company’s business and operating environment.
Look for:
- Industry conditions
- Demand trends
- Raw-material costs
- Competitive pressures
- Major business risks
- Capital expenditure plans
- Expansion plans
- Management’s expectations for the future
Don’t simply accept management’s explanation. Use it as a hypothesis and then check whether the financial statements support the story.
For example, if management says the business experienced strong growth, ask:
Did revenue actually grow?
Then ask:
Did operating profit grow?
And finally:
Did operating cash flow grow?
The numbers should broadly support the narrative over time.
Directors’ Report & Corporate Governance
This section can provide information about:
- Directors and key management
- Executive remuneration
- Board committees
- Major corporate developments
- Dividend decisions
- Corporate-governance matters
Pay particular attention when executive compensation rises sharply while profits, cash generation, or shareholder returns deteriorate.
The Marketing Trap
Annual reports often begin with glossy photographs, impressive graphics, letters from senior management, and optimistic descriptions of the company’s future.
These sections aren’t useless. They can help you understand how management views the business.
But remember:
Management’s narrative is a claim. The financial statements provide evidence.
Always compare the story in the front of the report with the numbers and disclosures later in the document.
Consolidated vs. Standalone Financial Statements
This is an important distinction for investors.
Standalone Financial Statements
Standalone statements generally show the financial position and performance of the parent company by itself.
Consolidated Financial Statements
Consolidated statements combine the parent company with its subsidiaries and, where applicable, account for interests in joint ventures and associates according to the applicable accounting standards.
For a business group with significant subsidiaries, consolidated statements are usually the better starting point for understanding the economic picture of the group as a whole.
However, don’t automatically ignore standalone statements.
Compare them when:
- The parent has significant debt
- Subsidiaries are loss-making
- There are large inter-company transactions
- The parent has provided guarantees
- Cash is concentrated in subsidiaries
- The parent company’s financial position differs significantly from the consolidated group
A company can appear financially strong at the standalone level while problems exist elsewhere in the group.
Section 2: The Three Core Financial Statements
The heart of an annual report is its financial statements.
Fundamental analysis relies heavily on three interconnected statements:
(Profitability)
(Financial Health)
(Cash Reality)
The real insight comes from connecting the three, rather than reading each one in isolation.
1. Profit & Loss Statement — Operational Performance
The Profit & Loss (P&L) statement shows the company’s revenue, expenses, and profitability over a period.
Revenue
Revenue is the money generated from the company’s business activities.
Don’t focus only on whether revenue increased.
Ask:
- Is growth consistent?
- Is growth coming from the core business?
- Is revenue growing faster or slower than the industry?
- Are receivables growing much faster than revenue?
A one-year revenue jump isn’t necessarily evidence of a strong business.
Operating Profit / EBITDA
EBITDA represents earnings before interest, taxes, depreciation, and amortisation.
A useful metric is the operating margin.
If revenue rises while operating margins steadily improve, it may indicate better efficiency, pricing power, or operating leverage.
But margins should always be considered in the context of the company’s industry.
Net Profit / PAT
Net profit—or Profit After Tax (PAT)—is the profit remaining after expenses, interest, taxes, and other applicable items.
Again, don’t look at one year’s profit alone.
Look at the trend over several years.
2. Balance Sheet — Financial Health
The balance sheet provides a snapshot of what the company owns and owes at a particular date.
The fundamental accounting equation is:
Assets = Liabilities + Shareholders’ Equity
Assets
Assets can include:
- Cash and cash equivalents
- Trade receivables
- Inventory
- Property, plant and equipment
- Investments
- Other current and non-current assets
Liabilities
Liabilities can include:
- Trade payables
- Short-term borrowings
- Long-term debt
- Lease liabilities
- Provisions
- Other obligations
Working Capital
A basic measure is:
Working Capital = Current Assets − Current Liabilities
Working capital needs to be interpreted in the context of the industry.
Don’t assume that positive working capital automatically means a company is financially healthy. The quality of current assets matters too.
For example, ₹500 crore of cash is very different from ₹500 crore of slow-moving inventory or doubtful receivables.
3. Cash Flow Statement — The Cash Reality
Accounting profit and cash generation are not the same thing.
The Cash Flow Statement shows how cash moved through the business.
It is divided into three broad categories:
Cash Flow from Operating Activities (CFO)
CFO represents cash generated from the company’s operating activities.
One of the most useful checks is to compare CFO with net profit over several years.
If a company repeatedly reports rising profits while operating cash flow remains weak or negative, investigate why.
It doesn’t automatically mean the accounts are misleading. There may be legitimate reasons.
But it is a signal that deserves attention.
Cash Flow from Investing Activities (CFI)
This includes cash spent on things such as:
- Property
- Equipment
- Investments
- Acquisitions
- Capital expenditure
Cash Flow from Financing Activities (CFF)
This includes financing-related cash movements such as:
- Borrowing debt
- Repaying debt
- Issuing shares
- Paying dividends
- Certain financing-related payments
Section 3: The MoneyDecider Four-Check Framework
To quickly assess a company’s financial quality, start with four important measures.
1. Return on Equity (ROE)
ROE = Net Profit ÷ Shareholders’ Equity
ROE measures how efficiently a company generates profit from shareholder capital.
A high ROE can be attractive, but don’t automatically assume that a high ROE means a superior business.
Debt can amplify ROE.
What to Look For
Look for stable and sustainable ROE over several years.
Then ask:
Is the ROE high because the business is genuinely profitable, or because the company is heavily leveraged?
2. Debt-to-Equity (D/E) Ratio
D/E = Total Debt ÷ Shareholders’ Equity
This ratio indicates how much debt the company uses relative to shareholder equity.
Generally, lower leverage can provide greater resilience during difficult economic conditions.
But there is no universal “good” D/E ratio for every industry.
A capital-intensive business may naturally operate with more debt than a software company.
What to Look For
Look for:
- Manageable debt
- Stable or declining leverage
- Debt that the company can comfortably service
- Debt growth that is supported by productive investment
3. Interest Coverage Ratio
Interest Coverage Ratio = EBIT ÷ Interest Expense
This measures how comfortably operating earnings can cover interest expenses.
For example, a coverage ratio of 2x means EBIT is twice the company’s interest expense.
A higher ratio generally provides a larger earnings buffer.
What to Look For
Don’t just calculate it for one year.
Look at the trend.
A company whose interest coverage is falling rapidly deserves closer examination, particularly if debt is rising at the same time.
4. Free Cash Flow (FCF)
A simple definition is:
FCF = Cash Flow from Operations − Capital Expenditure
FCF represents cash remaining after the company spends on capital expenditure.
Positive and sustainable FCF can give a company greater flexibility to:
- Reduce debt
- Pay dividends
- Make acquisitions
- Invest in expansion
- Build cash reserves
But remember that FCF can fluctuate significantly in capital-intensive businesses, so evaluate it over multiple years.
Section 4: Putting It Together — Company A vs. Company B
Ratios become much more useful when you use them together.
Consider two hypothetical companies from the same industry.
| Metric | Company A | Company B |
| Net Profit | ₹120 crore | ₹120 crore |
| Shareholders’ Equity | ₹600 crore | ₹1,200 crore |
| Total Debt | ₹900 crore | ₹200 crore |
| EBIT | ₹180 crore | ₹160 crore |
| Interest Expense | ₹90 crore | ₹15 crore |
| CFO | ₹70 crore | ₹145 crore |
| CapEx | ₹40 crore | ₹50 crore |
Let’s analyse them.
Step 1 — ROE
Company A:
₹120 crore ÷ ₹600 crore = 20%
Company B:
₹120 crore ÷ ₹1,200 crore = 10%
At first glance, Company A looks better.
Its ROE is twice that of Company B.
If you stopped here, you might conclude that Company A is the superior business.
But that would be premature.
Step 2 — Debt-to-Equity
Company A:
₹900 crore ÷ ₹600 crore = 1.5x
Company B:
₹200 crore ÷ ₹1,200 crore = 0.17x
Now the picture changes.
Company A has significantly more debt relative to equity.
Its higher ROE is therefore being amplified by much greater financial leverage.
ROE alone does not prove that Company A has superior underlying operations.
Step 3 — Interest Coverage
Company A:
₹180 crore ÷ ₹90 crore = 2.0x
Company B:
₹160 crore ÷ ₹15 crore = 10.7x
Company A’s EBIT covers its interest expense only twice.
Company B has a much larger earnings buffer.
If profits decline significantly, Company B has more room before interest payments become a serious burden.
Step 4 — Free Cash Flow
Company A:
₹70 crore − ₹40 crore = ₹30 crore
Company B:
₹145 crore − ₹50 crore = ₹95 crore
Company B generates substantially more free cash flow.
There is another important clue.
Company A reports:
Net Profit = ₹120 crore
but:
CFO = ₹70 crore
Company B reports:
Net Profit = ₹120 crore
and:
CFO = ₹145 crore
Company A’s operating cash flow is considerably below its reported profit.
That doesn’t automatically indicate accounting manipulation. However, the gap deserves investigation in the Notes to Accounts.
Ask:
- Are receivables increasing?
- Is inventory building up?
- Are there large non-cash items?
- Are working-capital requirements unusually high?
- Is the difference temporary or persistent?
The Verdict
If you judged these companies solely by ROE, Company A would appear to be the winner.
But after considering:
ROE + Debt + Interest Coverage + Cash Flow
the picture changes significantly.
Company B appears more financially resilient in this simplified example.
The lesson is important:
Never let one attractive ratio make the investment decision for you.
A good investor connects the numbers.
Section 5: Fine Print — Notes to Accounts & Auditor’s Report
Some of the most important information in an annual report can be found in the sections investors are most likely to skip.
That’s where the Notes to Accounts and Independent Auditor’s Report become especially important.
The Independent Auditor’s Report
Before diving deeply into the financial figures, inspect the auditor’s report.
A simplified way to think about the process is:
Report
Clean Opinion
analysis
specific issues
Unmodified / Clean Opinion
An unmodified opinion means the auditor concludes that the financial statements are presented fairly, in all material respects, in accordance with the applicable financial reporting framework.
A clean opinion is reassuring—but it is not a guarantee that the company is a good investment.
The auditor is expressing an opinion on the financial statements, not predicting the company’s future share price.
Qualified Opinion
A qualified opinion indicates that there is a specific matter affecting the financial statements that the auditor could not treat as fully acceptable, while the financial statements as a whole are not considered so materially misstated that an adverse opinion is required.
A qualified opinion deserves careful investigation.
Adverse Opinion
An adverse opinion is much more serious. It indicates that the auditor concludes that misstatements are both material and pervasive to the financial statements.
This should be treated as a major warning requiring substantial investigation.
Disclaimer of Opinion
A disclaimer means the auditor was unable to obtain sufficient appropriate audit evidence to form an opinion and concludes that the possible effects could be material and pervasive.
This is also a major warning sign.
Key Audit Matters (KAMs)
If the report contains Key Audit Matters, read them carefully.
KAMs highlight matters that, in the auditor’s professional judgment, were of most significance in the audit of the financial statements.
They may involve areas such as:
- Revenue recognition
- Asset impairment
- Valuation
- Provisions
- Expected credit losses
- Complex transactions
A KAM is not automatically a red flag.
Instead, treat it as a sign saying:
“This is an area that deserves your attention.”
Key Areas to Inspect in the Notes to Accounts
1. Related-Party Transactions
Look for transactions between the company and related parties, including promoter- or director-linked entities where applicable.
Related-party transactions are not automatically problematic.
The important questions are:
- What is the transaction?
- Who is the related party?
- How large is it?
- What are the terms?
- Is there a clear business purpose?
- Are the terms reasonable?
Large or unusual transactions deserve closer examination.
2. Receivables vs. Revenue Growth
Suppose revenue grows by 10%, but trade receivables repeatedly grow by 35%.
That doesn’t automatically mean something is wrong.
But it raises an important question:
Is the company generating sales that it hasn’t yet collected in cash?
Investigate the receivables trend and the company’s explanation.
3. Inventory vs. Revenue Growth
Similarly, if revenue grows slowly while inventory rises sharply, ask:
- Is demand weakening?
- Is inventory becoming obsolete?
- Has the company built inventory in anticipation of future demand?
- Are inventory provisions adequate?
Again, a divergence isn’t proof of a problem. It is a reason to investigate.
4. Changes in Accounting Policies or Estimates
Pay attention when companies change:
- Depreciation assumptions
- Useful lives of assets
- Revenue recognition policies
- Provisioning assumptions
- Valuation methods
Accounting changes can sometimes have legitimate reasons.
But when a change has a material effect on reported profits, understand why the change occurred and how it affected the numbers.
5. Contingent Liabilities
Look for obligations that may become actual liabilities in the future.
Examples include:
- Tax disputes
- Legal claims
- Guarantees
- Regulatory matters
- Other disputed obligations
The key question is:
Could this obligation materially affect the company’s future financial position?
Section 6: The MoneyDecider Annual Report Inspection Checklist
Use this checklist whenever you analyse a company.
| Annual Report Section | Positive Signal | Warning Signal |
|---|---|---|
| Auditor’s Report | Unmodified opinion and understandable KAMs | Qualified/adverse/disclaimer opinion or serious unexplained audit issues |
| Financial Statements | Consolidated statements provide a coherent picture of the group | Significant subsidiaries or group risks are ignored when looking only at standalone numbers |
| Revenue & Profit | Sustainable growth supported by operating performance | Profit growth appears disconnected from the underlying business |
| Cash Flow vs. Net Income | CFO broadly tracks or exceeds net profit over time | Net profit rises while CFO repeatedly declines or remains weak |
| Debt & Leverage | Manageable debt with adequate interest coverage | Rapidly rising debt and weakening interest coverage |
| Working Capital | Receivables and inventory broadly grow in line with business activity | Receivables or inventory repeatedly grow much faster than revenue |
| Notes to Accounts | Clear and understandable disclosures | Large or unusual transactions that are difficult to understand |
| Related Parties | Transactions have clear business purposes and understandable terms | Large or unusual promoter/related-party transactions requiring further investigation |
| Contingent Liabilities | Limited or manageable potential obligations | Large unresolved legal, tax, or guarantee exposures |
| Accounting Policies | Consistent policies with clear explanations | Material changes that significantly affect reported results without a convincing explanation |
| MD&A | Candid discussion of risks and challenges | Vague explanations that attribute poor performance entirely to external factors |
A Simple Reading Order for DIY Investors
You don’t have to read an annual report from page 1 to the final page.
For a first-pass analysis, try this order:
This approach helps you get to the important information quickly.
Conclusion: Learn to Read the Business Behind the Numbers
Reading annual reports is a skill that becomes more valuable with practice.
You don’t need to become an accountant to use them effectively.
You need to develop the habit of asking better questions.
When evaluating a company, start by asking:
Is the auditor’s opinion clean?
Am I looking at the right consolidated financial picture?
Are revenue and profits growing sustainably?
Does operating cash flow support reported profit?
Is debt manageable?
Is the company generating free cash flow?
Are receivables and inventory behaving sensibly relative to sales?
Are there unusual related-party transactions or contingent liabilities?
Does management’s story match the financial evidence?
The goal isn’t to find a single “perfect” ratio.
The goal is to connect the pieces.
Profitability tells you what the company earns.
The balance sheet tells you what it owns and owes.
Cash flow tells you what is actually happening with cash.
The Notes tell you what may be hidden behind the headline numbers.
The Auditor’s Report tells you how the financial statements were assessed.
And when all of these pieces point in the same direction, you have a much stronger foundation for making an investment decision.
Don’t invest because one number looks impressive. Understand the business first. Then decide.
Disclaimer: This guide is published by MoneyDecider strictly for informational and educational purposes and does not constitute financial, investment, tax, or legal advice. MoneyDecider is not a registered investment adviser or brokerage firm. All metrics, ratios, and hypothetical examples discussed are intended solely as educational tools and do not constitute individual buy, sell, or hold recommendations. Readers are strongly advised to perform independent due diligence and consult certified financial professionals before executing financial transactions.
Ask Your Money Question
Share your financial dilemma. Your question may become a helpful guide for others too.
About the Author
Naivedyanandan Sonowal is a former teacher and former APDCL professional who now works as a freelance journalist. He writes about real-life money decisions shaped by experience. Having managed loans, debt, and financial responsibilities firsthand, he shares practical insights to help readers think clearly before spending, borrowing, or investing. He is also the author of a book on smart retirement planning, available on Amazon.